
 EN
 TR
 ES
 FR
 ZH
 AR
 RU
 PT
 DE
 JA
 HI
 IT
 KO
 ID
Consumer Fuels — Retail Price Matrix
| Fuel | USD / unit | Local / unit | 7D |
|---|
Cost Estimator
km
Global Energy Commodities
USD · BENCHMARK
| Commodity | Price | 24h |
|---|
🗺 Cartes des Prix
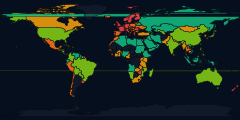
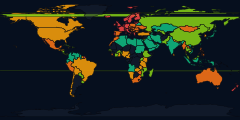
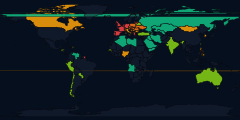
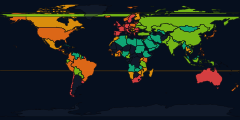
Global Fuel Price Rankings
Cheapest
Most Expensive
...
Fuel Affordability Index
GASOLINE · AVG WAGE
Most Affordable
Least Affordable
Classement Répercussion Essence 30J
BRENT · 30J · +5.0%
Répercussion Max marché libre
 Soudan
 Maurice
 Nouvelle-Zélande
 Tanzanie
 Kenya
 Biélorussie
 Maroc
 Bénin
 Mongolie
Répercussion Min a évolué à contre-courant du brut
 Pologne
 Philippines
 Irak
 Viêt Nam
 Macédoine du Nord
 Ouganda
 Moldavie
 Slovénie
 Égypte
100 % = le prix à la pompe a suivi le brut. Au-delà de 100 %, autre chose est intervenu : devise, fiscalité ou subventions. Un chiffre négatif signifie que la pompe a évolué à l'inverse du brut.
Vehicle Fuel Consumption Index
L / 100 KM